Predictable You
On actuarial tables
Dahlia S. Cambers

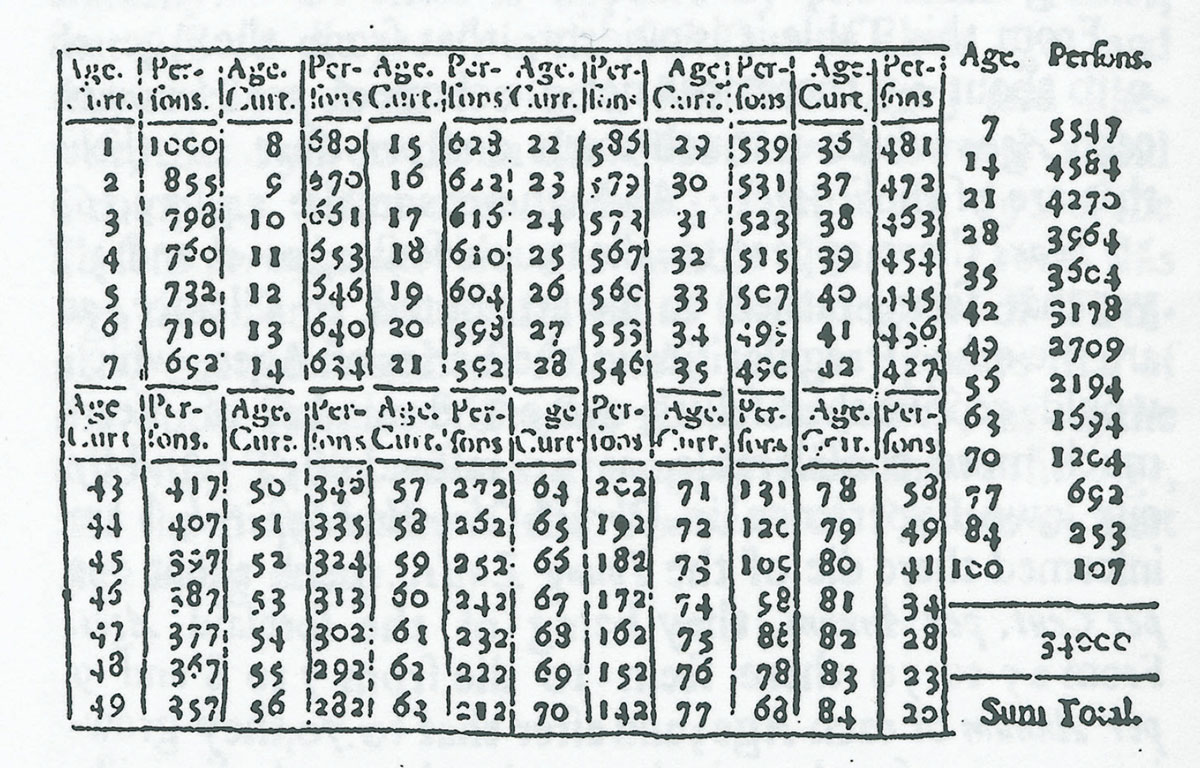
This life-table, originally published by Edmund Halley with his An estimate of the degrees of mortality of mankind drawn from curious tables of the births and funerals at the city of Breslaw with an attempt to ascertain the price of annuities upon lives (1693), is a founding document of life insurance, the business of applying laws of probability to the value of human lives. The chart reads in vertical columns from left to right: In the upper-left corner, for instance, Halley writes that 1000 people (of about 1100 live births) survive to the age of 1; 855 people to the age of 2; 798 to the age of 3; and so on.
When Halley published his life table, the concept of life annuities was not new. Since the Romans in fact, lives had been insured, usually on a one-year basis, payable by one lump sum, regardless of the age or health of the insured. Such annuities didn’t become profitable however, until it became possible to statistically determine a norm expectation of mortality and charge investors accordingly.
Although local parishes had long noted their dead, the ravages of the plague in the early 17th century prompted the city of London to follow suit. The results of this effort, weekly tabulations of deaths and christenings printed and distributed to the public beginning in 1604, were called the Bills of Mortality. In 1664, John Graunt, a merchant of notions who pursued actuarial science in his free time, decided to plumb the Bills for more information, admitting to a certain pleasure “in deducing so many abstruse, and unexpected inferences out of these poor despised Bills of Mortality.”
Graunt was aware that the records were selective—the age of death was not recorded, Catholics and Dissenters were excluded altogether—and also, contained a margin of error because the cause of death was not certified by medical diagnosis. Nonetheless, he felt confident using the data to extrapolate larger conclusions. Supplementing and qualifying the figures with his own observations (for instance, he suspected syphilis to be more common than the records indicated, so he concluded that a percentage of the persons reportedly dying of “ulcers and sores” were actually victims of venereal disease; he hypothesized the number of “teeming” [fertile] women to be double the number of annual births), Graunt’s groundbreaking Natural and political observations made upon the bills of mortality crudely determined an annual mortality rate and pioneered the methodology of statistical sampling. Graunt’s goal, however, was neither of these, but to determine the population of London. This he set at 384,000, probably a fairly accurate number, according to contemporary historians. Commonly believed at the time to be 1 or 2 million, Graunt’s low estimate provoked more controversy than his revolutionary methodology.
Halley, famous astronomer and the comet’s namesake, was acquainted with Graunt’s work when he serendipitously discovered that due to an assiduous pastor, the small town of Breslaw in eastern Germany possessed meticulous records of the town’s births and deaths for the years 1687–1691. Moreover, Halley observed, the “Confluence of Strangers is but small,” at Breslaw, suggesting a data set more stable than London’s Bills of Mortality. Using the statistics of Breslaw to calculate the probability of death at different ages, Halley was able to determine correspondingly appropriate annuity rates. Halley submitted his lucrative recommendations for the government sale of life annuities to the English crown, but they were ignored for nearly a hundred years.
The last major figure in this history is Abraham De Moivre, a French Huguenot refugee who lived in England. De Moivre’s Annuities on lives (1725) improved on Halley’s tables by developing the means to calculate life expectancy from an age besides birth. Whereas Halley determined that 41% of the men of Breslaw survived to age 70, De Moivre was able to mathematically deduce the life expectancy of a 50-year-old man. De Moivre perhaps is better known for his discovery of the bell curve, the statistical measure of dispersion around a mean, and for accurately predicting his own death: At age 87, De Moivre observed that he was sleeping an additional 15 minutes every night. Equating his demise with 24 hours of sleep a day, he died right on schedule.
Works Cited
Peter L. Bernstein, Against the Gods: The Remarkable Story of Risk (New York: John Wiley & Sons, Inc., 1996).
M. Campbell-Kelly, M. Croarken, et al., eds., The History of Mathematical Tables (Oxford: Oxford University Press, 2003).
Chris Lewin, “Earliest Days,” in Derek Renn, ed., Life, Death and Money: Actuaries and the Creation of Financial Security (Oxford: Blackwell, 1998), pp. 9–28.
Terence O’Donnell, History of Life Insurance in Its Formative Years (Chicago, IL: American Conservation Company, 1936).
Dahlia S. Cambers is an independent scholar based in Columbus, Ohio.